Computer Graphics Survey
Map Elements
Using FreeHand 8.0 on MacOS Computers
| previous handout |
ACG Home |
Instructor Home |
Class Home |
list of tutorials |
next handout |
Before beginning the project
Read the
information that pertains specifically to the way the ACG Lab operates.
This section of the directions may not apply if you work on the project elsewhere.
To create the map of where we live/work/study/play, we will use a vector graphics program called FreeHand. Vector graphics differ from raster graphics (such as the scanned images, which we edited with Photoshop) in very important ways.
The main benefit of using a vector program for our map is that viewers will be able to zoom in smoothly from a planetary view to a county level view.
Of the three widely used vector programs (Illustrator, FreeHand, Corel Draw), we will use Macromedia FreeHand because its files can be compressed and embedded in web pages through the Shockwave technology.
In this initial step, our main concern will be proper organization of the document and use of the selection and transformation tools. We will:
- Launch the FreeHand application:
- File-->Preferences. Click on the category 'General'. Make sure that 'Remember Layer Info' is checked, then click 'OK' (this will paste the selection in the same layer it was copied from--if the layer is missing, it will be created automatically).
- Find the world map or globe picture you like best and open it:
- Learning to draw complex shapes (such as map outlines) using a vector graphics program requires more time than we have available in this class. Instead, the map will be assembled from parts provided by the instructor as clip art.
- The clip art files are in an older format, so you won't be able to open them by double-clicking. You can instead drag their icons and drop them on the FreeHand application icon.
- In some cases the image is positioned outside the page and you won't see anything when you open the document. If this happens, you can:
- Use Edit-->Select-->All In Document to select the image, regardless of its location.
- Use View-->Fit Selection to scroll and zoom, displaying what you just selected.
- Use the File-->Save As command to rename the picture you chose as your own map document:
- The exact name you use doesn't matter at the moment, since we will later export a separate file with a different name for posting on the web.
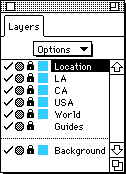
- A new FreeHand document will automatically contain three layers, named 'Foreground', 'Guides', and 'Background'. Rename the Foreground layer to indicate that it contains a picture of the entire world:
- If the Layers panel is not visible, display it using Window-->Panels-->Layers.
- Double-click on the name of the Foreground layer, type the new name world, then press the Enter key.
- Lock the layers that you are not going to use at the moment. Locking is one of the main advantages of using layers, since it keeps you from accidentally disturbing parts of the picture other than the one you are working on:
- Click on the padlock icons next to the World, Background, and Guides layers to close the padlocks.
- Now proceed to bring in the additional pictures for more detailed maps. Each one will be on a separate layer, renamed as indicated below:
- Find and open the map of the entire United States that you like best.
- Use Edit-->Select-->All In Document to select the entire map. Use Edit-->Copy to place the US map in the clipboard. Close the US map document.
- With your own document window active, use Edit-->Paste to retrieve the US map from the clipboard: it will appear on a new 'Foreground' layer, which gets added to the list in the Layers panel.
- Double-click 'Foreground' in the Layers panel, enter USA, press the Enter key.
- Click the layer's padlock icon to lock it.
- Repeat the process for a map of the state of California. Rename its layer to CA
- Repeat the process for a map of the Southern California area. Rename its layer to LA
- Finally, select an appropriate symbol for your home, and/or place of work, and/or school. Rename its layer Location.
- There are various categories of clip art symbols in the same folder as the map clip arts.
- To preserve the correct front-to-back order, make sure that each new layer appears above the previous ones in the Layers panel list.

- The sequence of layers after all the pictures have been imported should be:
- Location
- LA
- CA
- USA
- World
- Guides
- Background
- If necessary, you can click on the name of a layer and drag it up or down to rearrange the sequence.
return to top
- Your goal is to superimpose the maps so that, as viewers zoom in, they see an increasingly detailed picture of your part of the world.
- Before working on a layer, unlock it by opening its padlock icon. Remember to lock the layer again when done with it.
- Another benefit of using layers is that their contents can be easily hidden, allowing easier access to parts of the drawing that would be otherwise hard to see. Hiding and showing a layer is done by clicking on the check mark next to the layer's name.
- Use the Selection tool (the arrow, 1st at the top of the toolbox) to:

- Click on a picture to select it in its entirety (all the pictures you imported are grouped).
- Grouping means that two or more shapes are 'glued' together so that they can be handled as a single unit.
- Option-click to select just a part of the picture. Click again on a control point (one of the small boxes that appear along the outline of the shape) to select just that point (it will change from a solid box to an outline box).
- Drag a selected point to reshape the object.
- Drag within a selection to move the entire object.
- Drag one of the corner handles of a selected group to resize it.
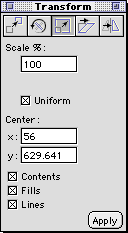
- Before resizing, use Window-->Panels-->Transform. Click middle tab ('Scale'). Make sure 'Lines' is checked (when you resize a part of your drawing, this will change the thickness of the lines along with the overall size of the object).

- If you wait briefly before dragging, the cursor will change to a cross shape and you will see a more accurate preview of the image as you transform it.
- Drag with the Rotate tool (6th from the bottom in the toolbox) to re-orient the selection:

- The location where you initially click becomes the center of the rotation. The amount of dragging determines how far the selected object(s) rotate.
- Use the Knife tool (7th from the bottom in the toolbox) to cut off any unwanted portions of the selection:

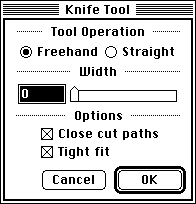
Make sure to choose appropriate Knife tool settings first, as shown below:
- Double-click the Knife tool in the toolbox. In the dialog that appears, choose 'Freehand' and 'Close cut paths', drag the slider to the left (zero width), then click OK.

- Before using the Knife tool, Option-click with the Selection tool to select just the shape you want to edit
- Switch to the Knife tool and drag to indicate where to cut the shape. The shape will be broken into two separate shapes along the cut.
- Press the Tab key to deselect. Option-click with the Selection tool to select the part of the shape that you don't want, then press the Delete key to remove it.
- When done, make sure to save this FreeHand document on your Zip disk. We will re-use this file in the following session.
| return to top |
Notes
- Vector graphics files store the picture as separate shapes instead of rows of pixels (= color spots). All you have to do to select a shape is click on it, instead of tracing around its outline.
- The shape can be smoothly scaled to any size--or, put another way, you can zoom in and see additional detail. Zooming in on raster images only magnifies the color spots without revealing anything else of interest.
- Scaling up smoothly is equivalent to increasing the smoothness of the edges while keeping the size unchanged. This means that vector images can immediately take advantage of higher resolution devices like laser printers or imagesetters, without increasing file size. Raster images will need to be processed/recreated, and the file size will increase.
- The transformations (rotation, scaling, skewing, etc.) that caused irreversible degradation of raster images (resampling), can be applied to vector images without ill effects.
- For a diagrammatic picture like a map, vector files are also generally smaller in size. The size of a vector image file increases as its complexity (number of image elements) increases--it is not affected by the width and height of the picture.
| return |
- Some basic features are shared by most vector graphics and raster graphics applications. The following highlights the differences as well.
- The first action we want to perform is the creation of some graphic objects. We will notice that in this respect the similarities between the two programs outweigh the differences.
- Next in our progression we want to be able to choose which objects to work on further. This is called selecting, and here is where the two programs differ the most.
- Finally, once we have selected an object, we want the computer to transform it. In this respect the programs may show some similarities, but on closer inspection the outcomes appears noticeably different.
- The underlying reason for the differences between vector graphics and raster graphics is the different kind of information that each retains about pictures.
- The raster graphics program will maintain an unbroken list of the colors (or gray values) of each minute area (called pixel) making up the image. Accordingly, raster graphics are generally known as bit-mapped, or raster, graphics.
- The vector graphics program, instead, will maintain a list with separate entries for each object (usually, a geometric shape) appearing in the image. Accordingly, vector graphics are generally known as object-oriented, or vector, graphics.
- On account of their differences, vector and raster programs are best suited for different applications. Each takes best advantage of the programs' capabilities and minimizes the drawbacks.
- A vector graphics (object-oriented graphics) program, as we have already learned, constantly keeps track of each separate graphic object that makes up the image. These objects do not "blend" into the bacgkround, as would happen in a raster graphics program: they preserve their individual attributes, and can always be transformed at a later time.
- In a vector graphics (resolution-independent graphics) program, the number of pixels used to draw a given shape is not preset. Therefore, when printing on a high-resolution device (such as the laser printer), more pixels will be employed, thus more closely approximating a smooth curve.
- A vector graphics program (drawing) is particularly appropriate when many changes and highly complicated images are anticipated, such as in the creation of a newspaper layout, or in the design of an utilitarian object. Appropriate "page make-up" and "computer-aided design" programs are used for these types of projects. Both are special variations on the basic vector graphics program idea.
- A vector graphics (illustration) program is useful to create "hard-edge" graphics -- the kind that would be produced traditionally with pen-and-ink tools. The computer lends a hand in making these precise images appear sharp and clean, providing the means to create smooth curves and lines effortlessly.
- Finally, a vector graphics program must be able to describe each graphic object as a geometric shape (the 'vectors' in vector graphics). This can limit the type of pictures that can be produced with these programs.
- The difference between raster graphics and vector graphics (as represented by 'painting' and 'illustration' programs, respectively) is so fundamental that you will find it in all areas of computer graphics. One such example is offered by the handling of letterforms on the computer.
- The letters that make up any text displayed on the screen are made up -- as you can tell by looking closely at them -- by a number of appropriately placed pixels. They are, therefore, just like any other image produced by the computer. There are, however, two different ways in which these letterforms can be produced. The difference is along the familiar lines of "bitmap versus vector".
- Since the final result, whether on the screen or on paper, is always a group of pixels, bitmap letterforms have a speed advantage over vector letterforms (which, ultimately, will have to be converted to bitmaps -- one extra step in the process). In addition, no special computations are needed for bitmaps -- they are simply copied to the output device "as is". Therefore, bitmaps are favoured when speed and simplicity are the main concerns. Typically, video displays (requiring immmediate response) and low-cost printers (requiring cheap processing) will use bitmap letterforms.
- The alternative to bitmap (or raster) typefaces is outline (or vector) type.
- When printing to most laser printers, you are actually sending to the printer program instructions that describe the shapes you want on paper. This description is written in a special language called PostScript. Normally you don't write a PostScript program directly. Rather, you let a graphics program (such as FreeHand) write it for you. PostScript is very important to computer artists because it is a widely accepted standard: the same programs will be understood also by very high resolution laser imagesetters--so the same picture files can print with finer details.
- Among the shapes described by your PostScript programs are the letters used for text. These are vector pictures, not unlike the ones made with FreeHand. Vector type offers the following advantages: the letterforms can be scaled to any size required without distortion; the storage occupied is less than that required by several fixed-size bitmaps. Disadvantages: the processing involved in converting vector graphics to the bitmap format (ultimately required for display and/or printing) will result in slower and more expensive operations.
- PostScript outlines intricate drawings with free-form curves called splines, which are the building blocks used in FreeHand drawings.
- The shapes of letters are complex enough to require a highly flexible geometric description. This is obtained through the use of splines. Splines come in two types, interpolating and non-interpolating.
- The first term indicates splines that pass through their control points. Advantages: their behaviour is more predictable. One application for them is to draw the paths of objects in animation. An example is the Catmull spline.
- Non-interpolating means, as you might expect, that the splines does not go through their control points. It is therefore less obvious where they will end up--learning to draw with them takes longer. Advantages: the curves will be much smoother. The non-interpolating splines used in PostScript are called Bezier curves.
| return |
Information specific to the ACG Lab
- On ACG Lab computers, the program FreeHand is in the Drawing folder on each station's startup drive.
- There are clip art elements available for this project on the file server. Look in this week's folder in the Class Materials folder for your class in the ACG_FILE volume.
- Help and documentation on FreeHand are on the lab file server, in the ACG_DOCS volume.
- The Art Computer Graphics program of Fullerton College offers a class covering both FreeHand and Illustrator, ACG112 Electronic Illustration. Find it in the class schedule.
return
| previous handout |
return to top |
next handout |
|
This document originally at <http://acg2.fullcoll.edu/FACULTY/CORSI/LEARN/OVERVIEW/OV100MAC/INDEX.HTM>
|
|
Copyright 1997-2000 by Sandro Corsi.
Last modified 2000-10-25.
|
SaneDraw home
|